System Selection
Part of POS reporting
Comparing basket value across trading periods consistently
Average basket value is useful only when the numerator and denominator refer to the same kind of sale.
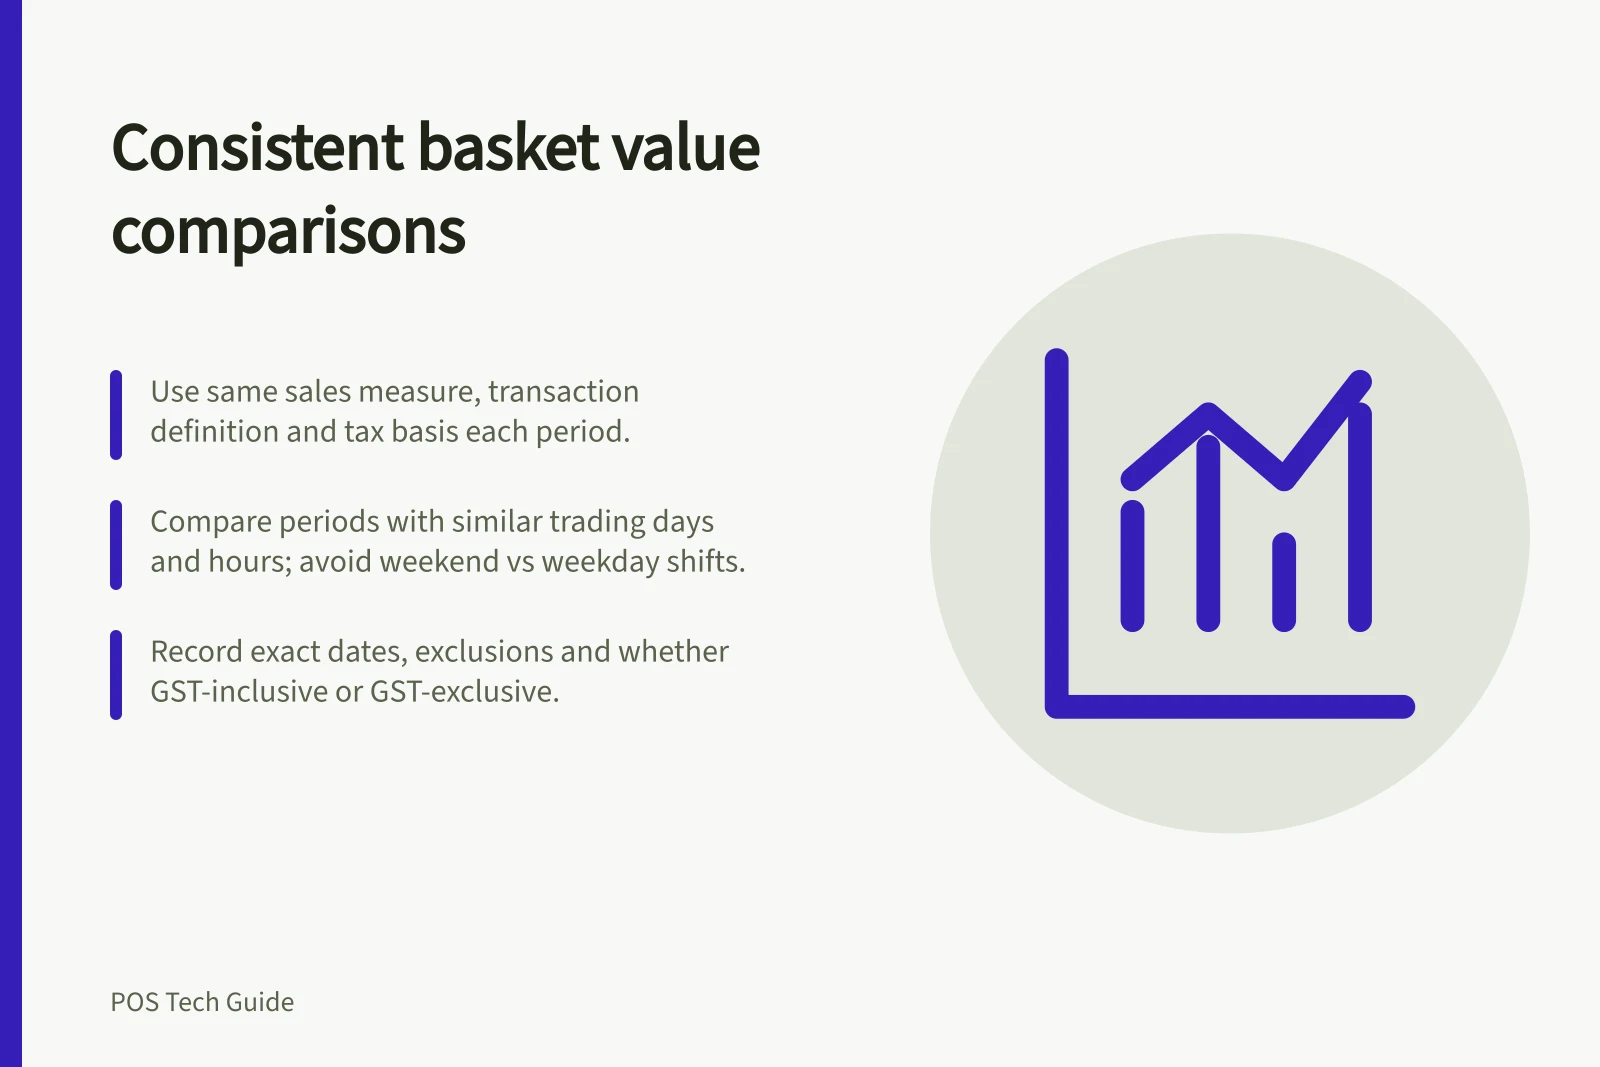
To compare average basket value across periods, use the same sales measure, transaction definition and tax basis each time. Choose comparable daily, weekly or yearly periods, then calculate and compare each period’s average separately.
Make the calculation reproducible
For each period, calculate average basket value as selected sales ÷ eligible completed transactions. Compare two periods with: percentage change = (later-period average ÷ earlier-period average − 1) × 100. Use the same definition of selected sales and eligible transactions for every period.
Choose a baseline you can repeat, such as one weekly period against another or one yearly period against another. Keep the periods similar in trading days and hours; comparing a weekend promotion with an ordinary weekday is a weak comparison. Record the exact dates and any exclusions.
Decide whether selected sales are GST-inclusive or GST-exclusive and keep that basis consistent. Square defines gross sales as product sales including modifiers, before refunds or discounts, and excluding taxes and tips; it excludes Square Gift Card sales but includes products paid for with those gift cards. Square defines net sales as gross sales minus discounts and refunds, and says net sales do not reflect Gift Card sales.
Square’s sales summary and sales trends reports compare daily, weekly and yearly sales. In Square Dashboard, users with detailed sales-reporting permission can view full historical data and comparison charts; the point of sale app’s sales summary covers the past 90 days for users with limited reporting permission.
Square defines gross sales, net sales and total collected separately, so these measures can produce different averages. Label a custom calculation rather than presenting it as a platform’s built-in metric, and keep refunds, tips, taxes and gift cards consistently in or out according to the question and the POS definition.
Compare transaction counts as well as averages. A higher average after small transactions disappear has a different context from a higher average with stable transaction volume.
Key Metrics for Reproducible Basket Value Calculation
- Sales Measure Consistency
- Use same definition (e.g., gross sales) across all periods
- Transaction Definition
- Eligible completed transactions only, no refunds or discounts included in numerator
- Tax Basis
- Consistent use of GST-inclusive or GST-exclusive throughout
- Period Alignment
- Compare similar trading days (e.g., weekly periods with same weekday mix)
Steps to Ensure Reproducible Basket Value Comparisons
- Define selected salesChoose whether to use gross sales (inclusive of modifiers, excluding taxes and tips) or net sales (after discounts and refunds)
- Define eligible transactionsInclude only completed transactions; exclude voids, refunds, and unprocessed orders
- Fix tax basisDecide on GST-inclusive or GST-exclusive and apply consistently across all periods
- Align time periodsUse comparable durations (e.g., full weeks or fiscal years) with similar trading hours and days
- Record exclusions and filtersDocument any excluded sales types (e.g., gift card payments) and reporting permissions
Look beyond the average
Check basket-size bands or representative transaction records where available. A few unusually large orders can raise the average without changing typical shopping behaviour.
Review discounts, category mix and returns alongside the average. If a promotion sets a minimum-spend threshold, examine the distribution around that threshold rather than assuming every larger basket reflects a lasting habit.
Record the measure, filters, dates and exclusions beside the comparison. State the observed change and the possible causes to test.
Pre-Comparison Checklist for Reliable Basket Value Analysis
- Confirm consistent metric usageSame sales measure and transaction type used across all periods
- Verify tax treatment consistencyGST-inclusive or GST-exclusive applied uniformly
- Check for outliersReview high-value transactions that may skew the average
- Examine discount impactAssess if promotions influenced basket size around threshold levels
- Compare transaction volumeEnsure higher averages aren’t due to fewer, larger transactions